Fully customisable widgets
on the Dashboard
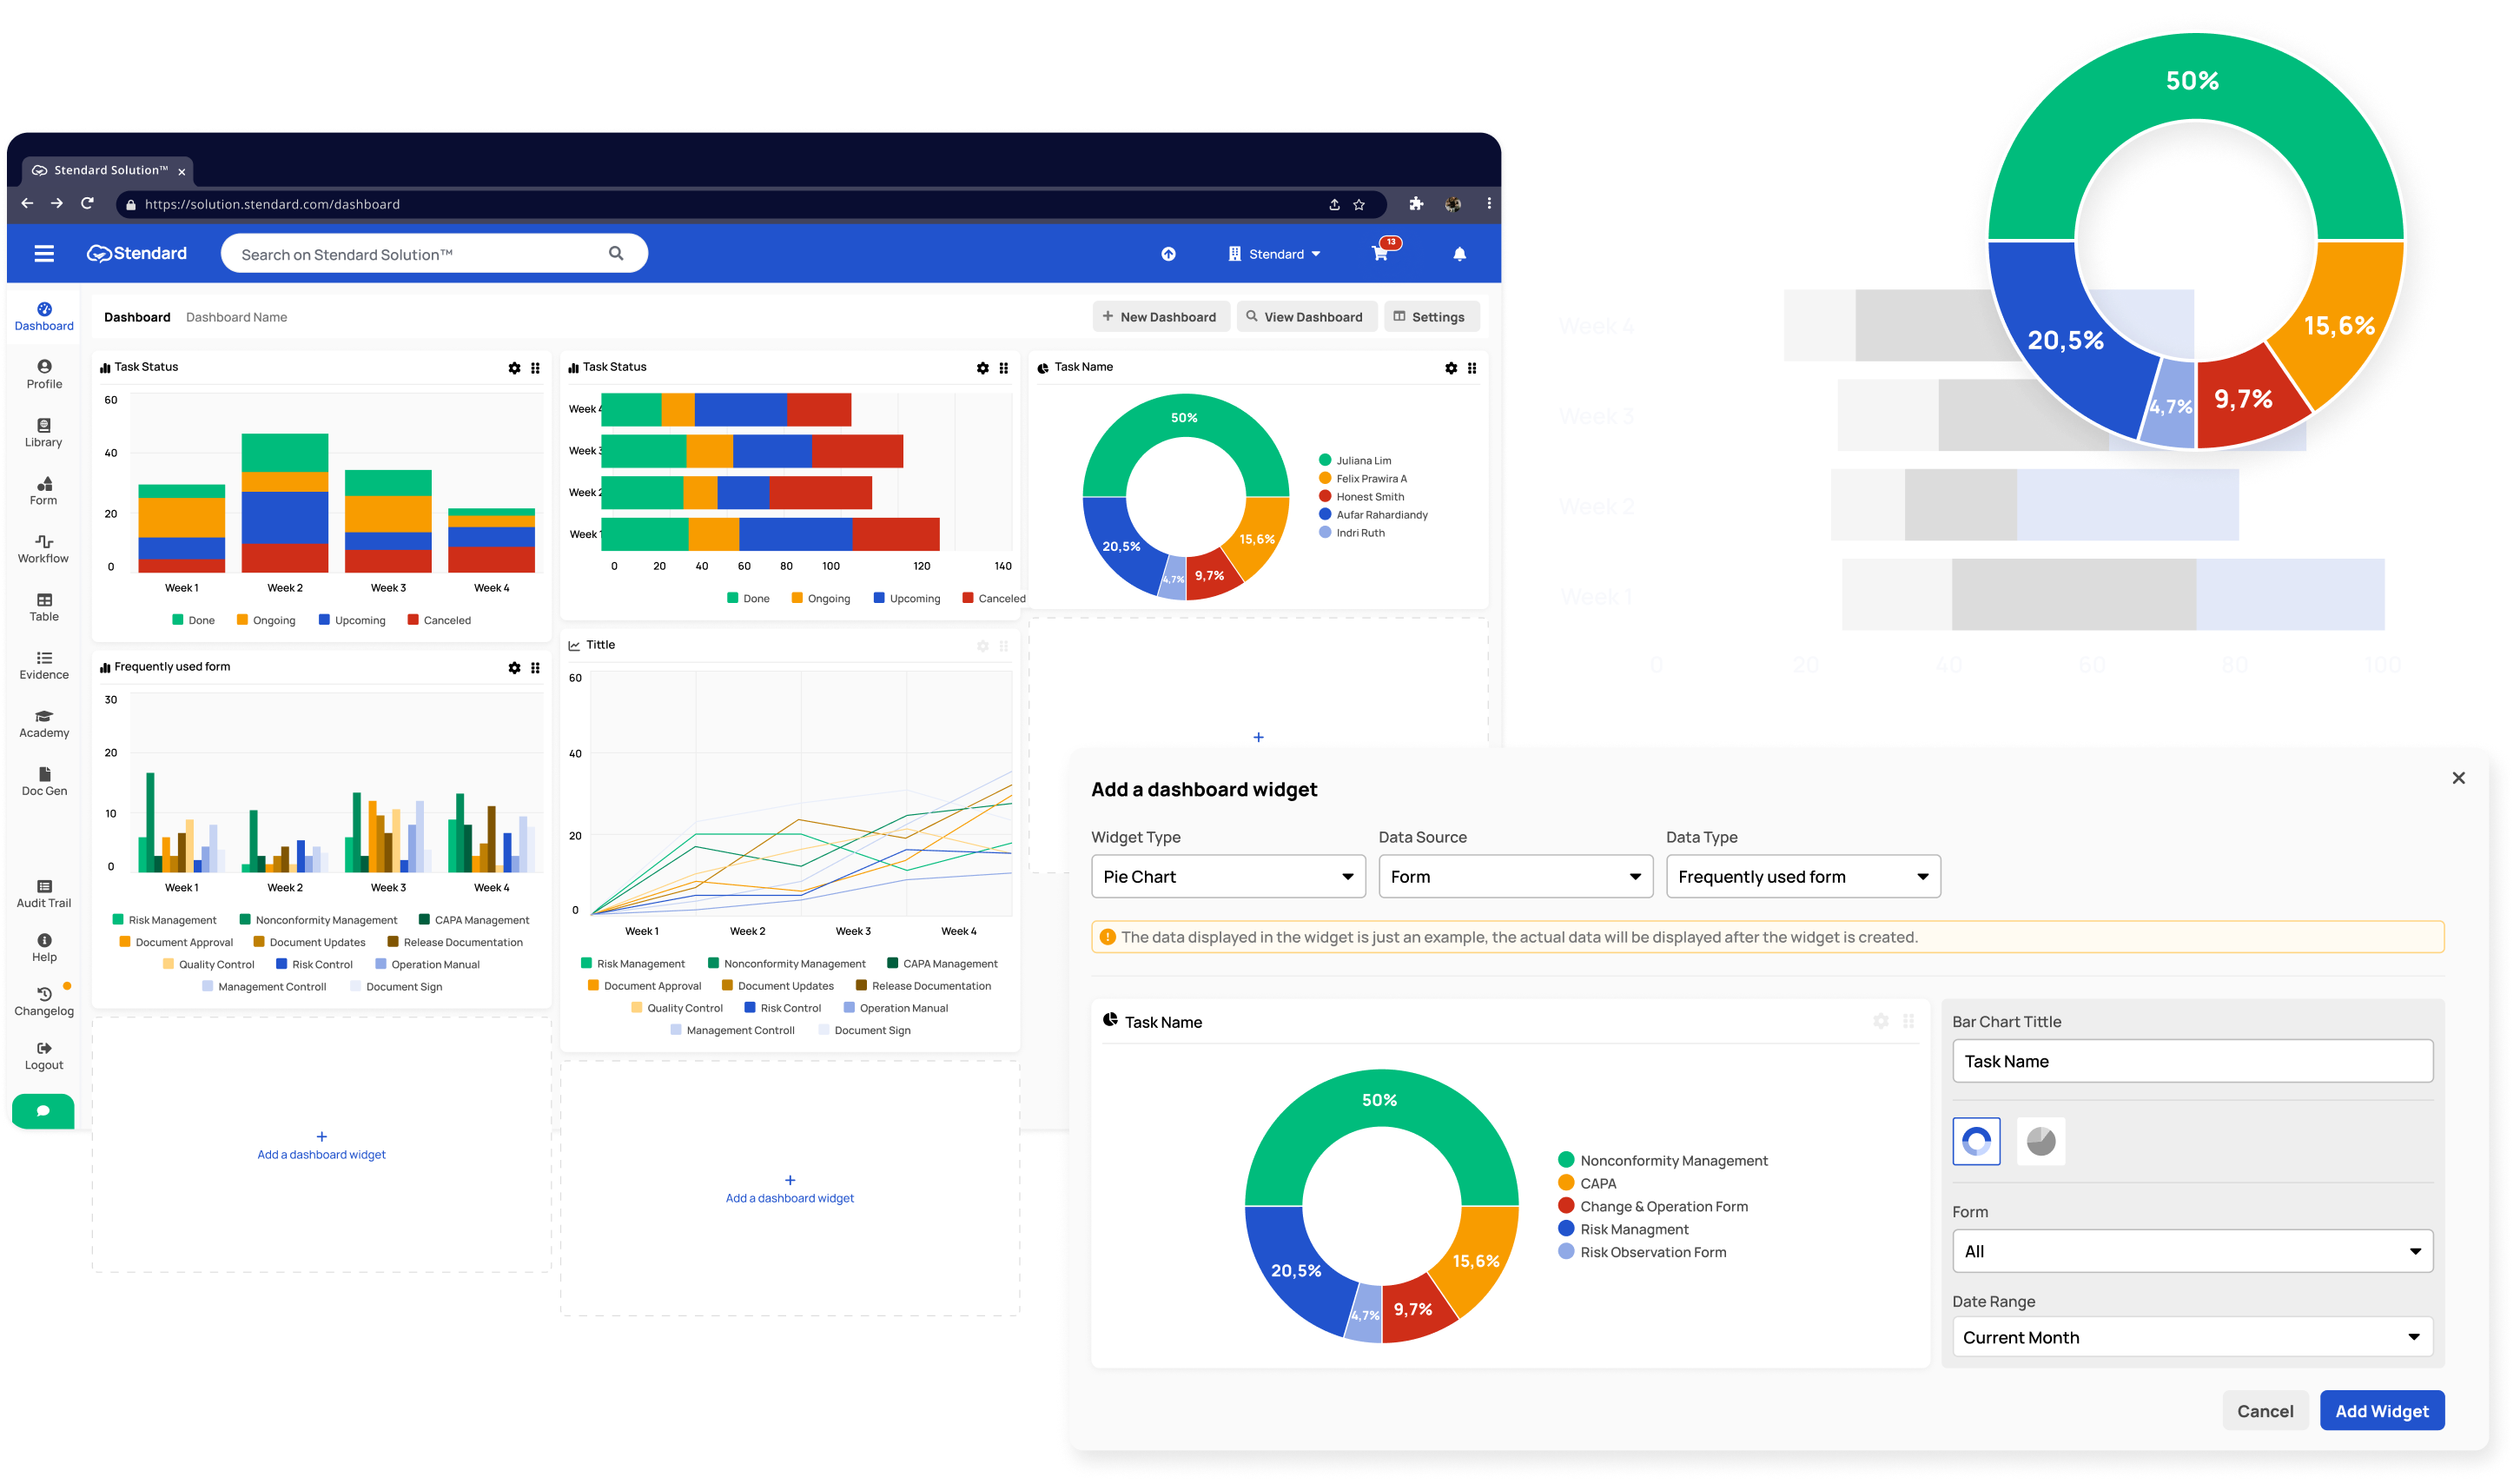
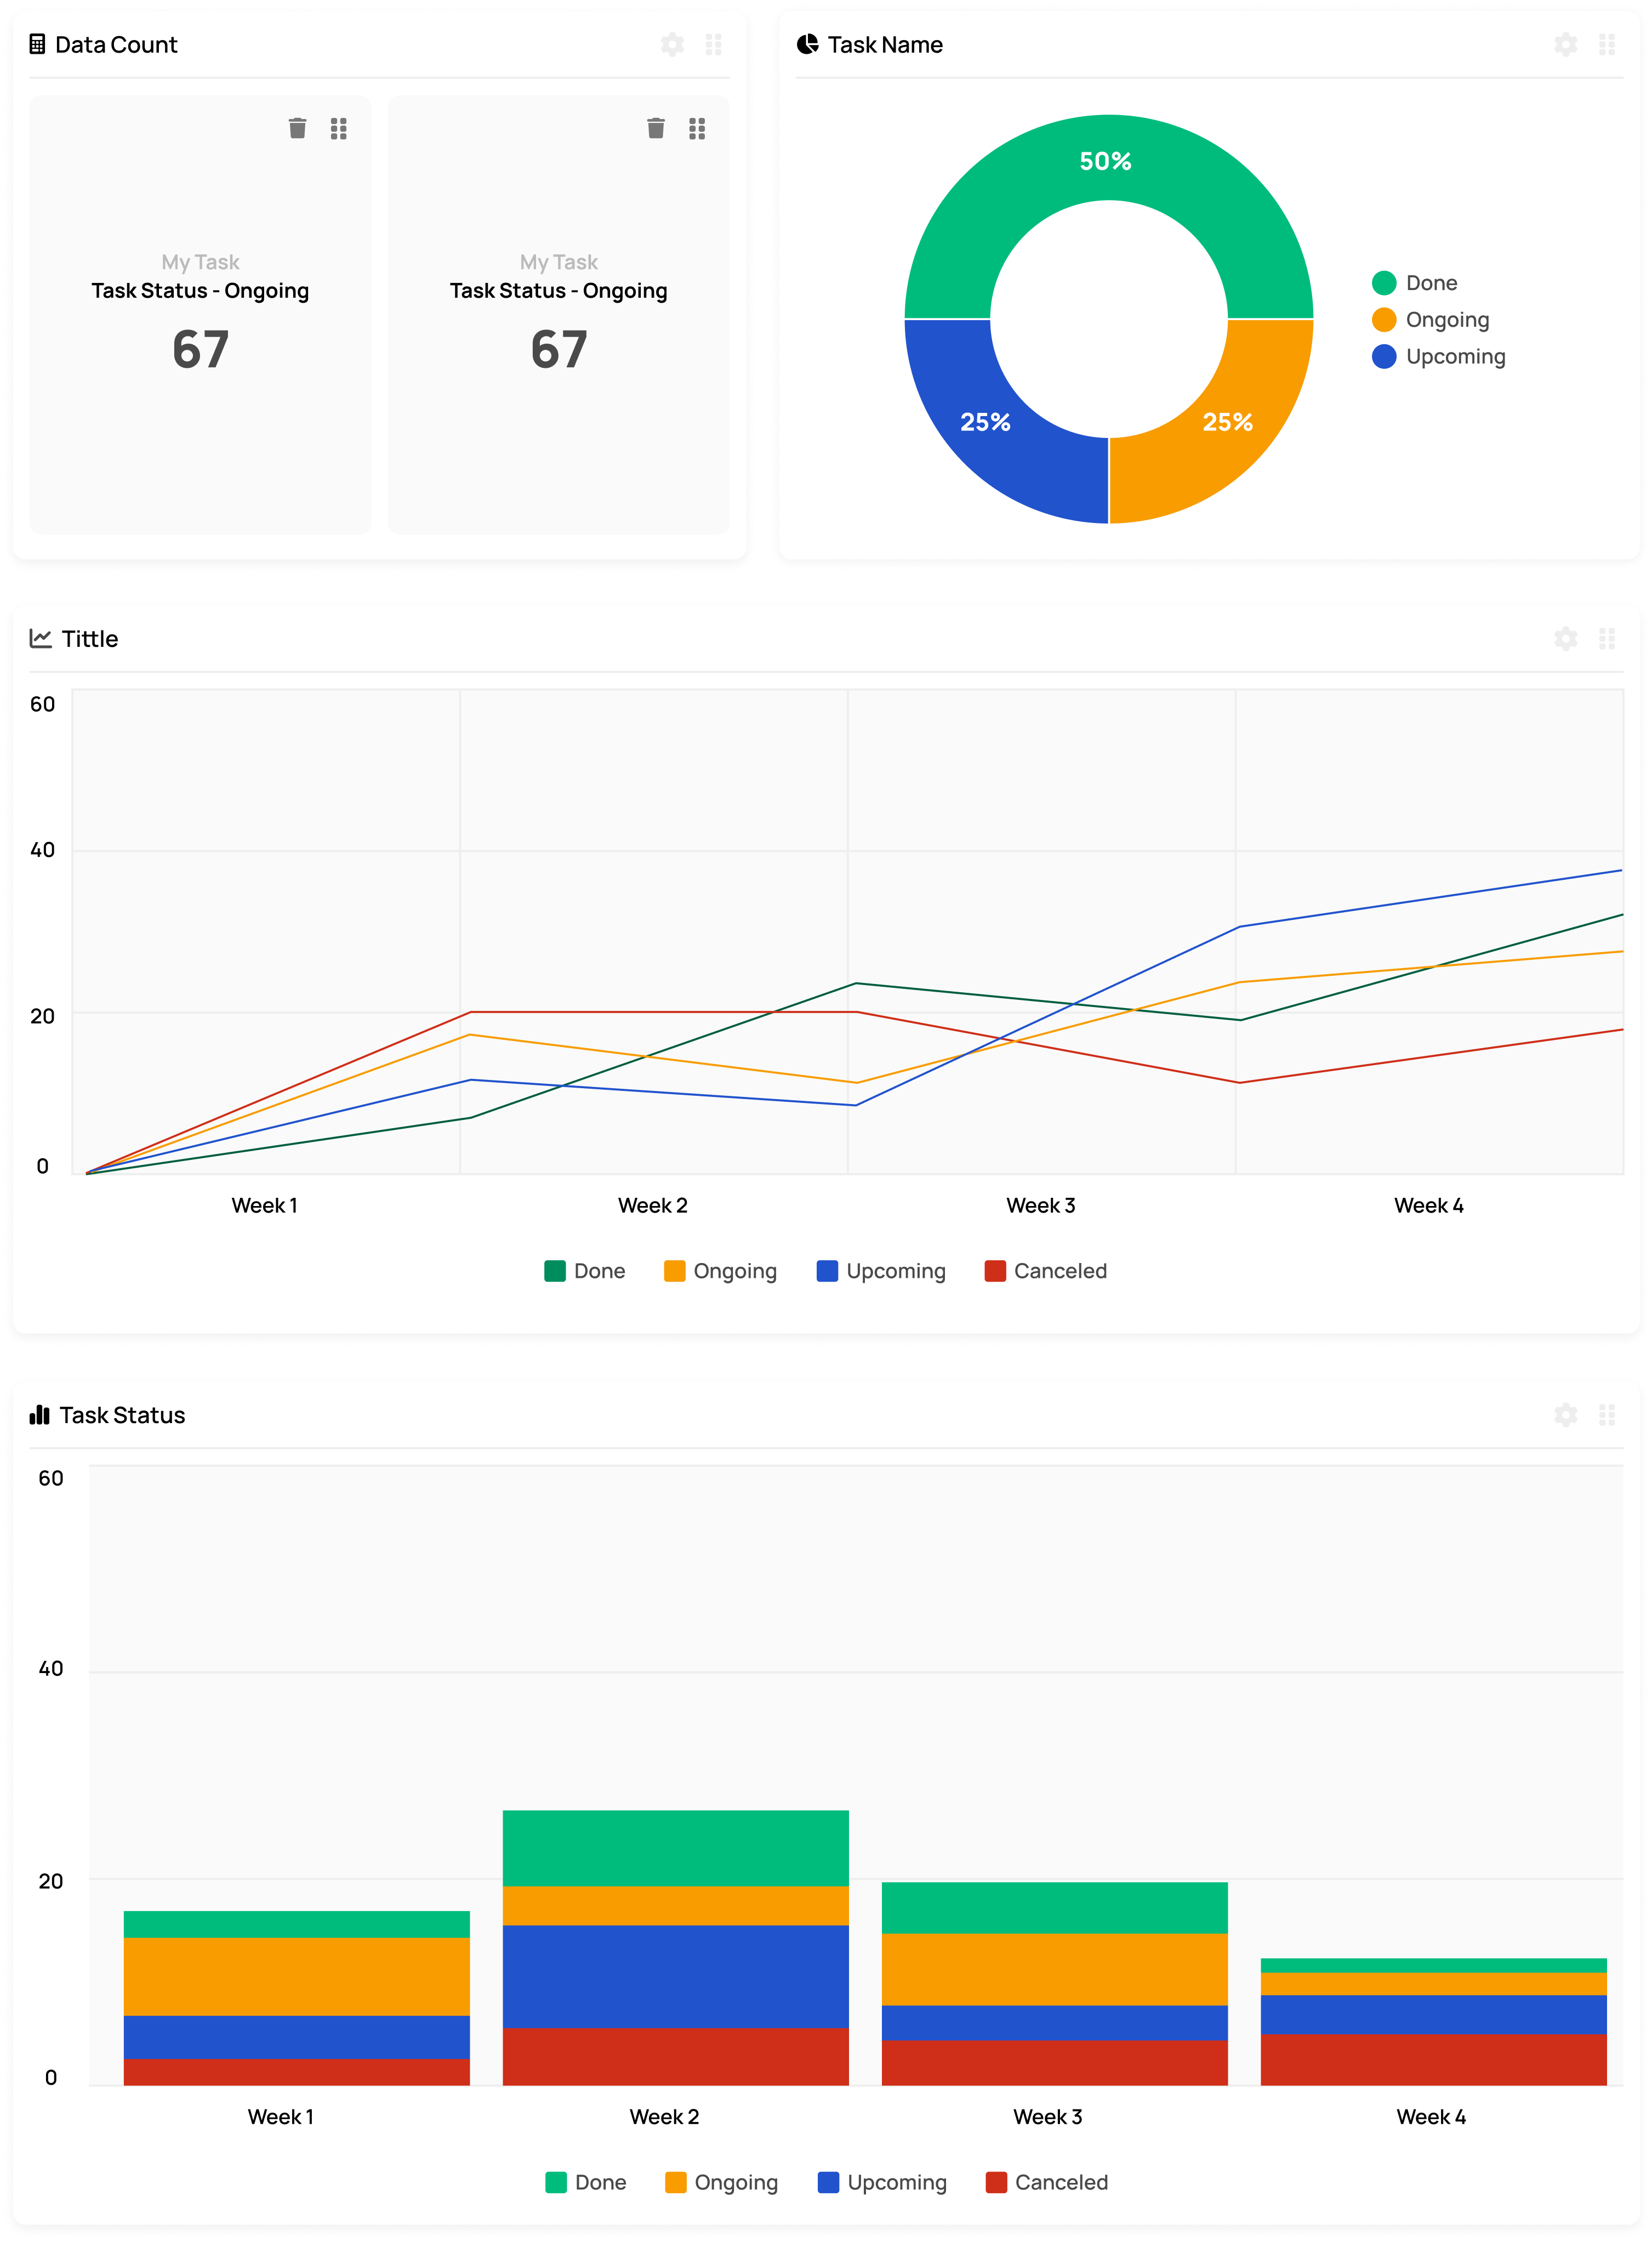
Introducing the ultimate data display solution – our software’s customisable widgets on the Dashboard page! With varying widget types available, including List, Count, Pie chart, Bar chart, and Line chart, you can transform your data into easily understandable and interpretable visuals that reveal potent insights.
With our List widget, you can view detailed information on each data row in a table view, while the Count widget lets you see the total data in a data source – such as the number of customers or total sales.
Meanwhile, our chart widgets, such as Pie charts, Bar charts, and Line charts, take your data to the next level by displaying it in a more visually appealing and interactive format. Our Pie charts let you easily depict the proportion or percentage of data in a circular or pie form, while Bar charts show data in vertical or horizontal bars. And our Line charts reveal data trends or changes over time, providing you with a dynamic view of your data.
With the different types of widgets available, we empower you with the flexibility to customise the display and data format on the Dashboard according to your needs and objectives, allowing you to monitor and analyse information or data like never before. Take control of your data with our widgets and unleash the power of your insights today!
Modifying your widgets to your changing needs
Are you looking to take your data display to the next level? You now have the power to modify existing widgets on the dashboard page according to your personal or organisational needs.
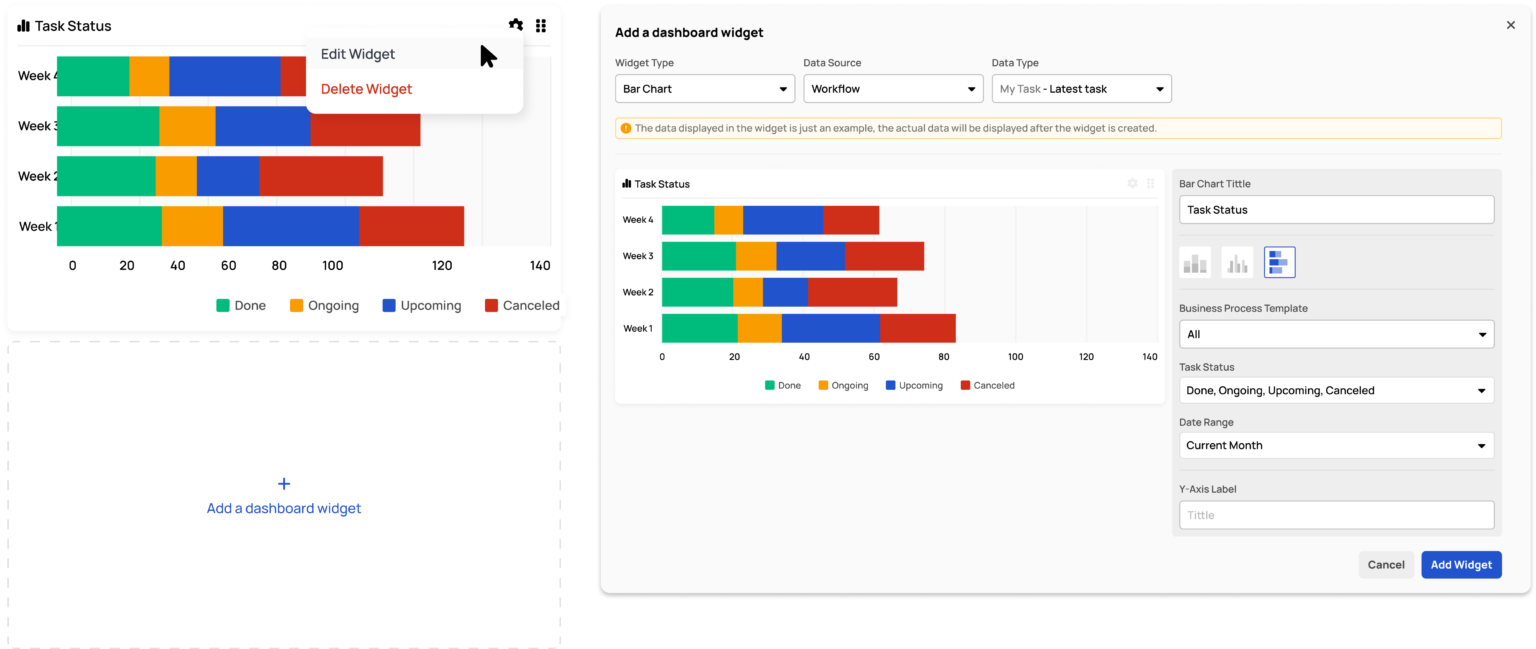
With our intuitive add widget function, you can quickly and easily add new widgets to the dashboard page. Whether you need a graph, table, or task list, we got you covered. Once you’ve selected the type of widget you want to add, it’s easy to adjust and customise the settings according to your needs. Our powerful filtering tools simplify selecting the data you wish to display, so you can get the insights you need in real-time.
But we know that sometimes, things change. That’s why our software also allows you to edit or delete widgets that no longer serve your needs. With our simple delete function, you can quickly remove any widgets irrelevant to your dashboard, making room for the most critical insights.
Our powerful widget modification functionality changes how you display and analyse your data. Take control of your data like never before and discover the power of real-time insights today!
Configure the data source of your widget
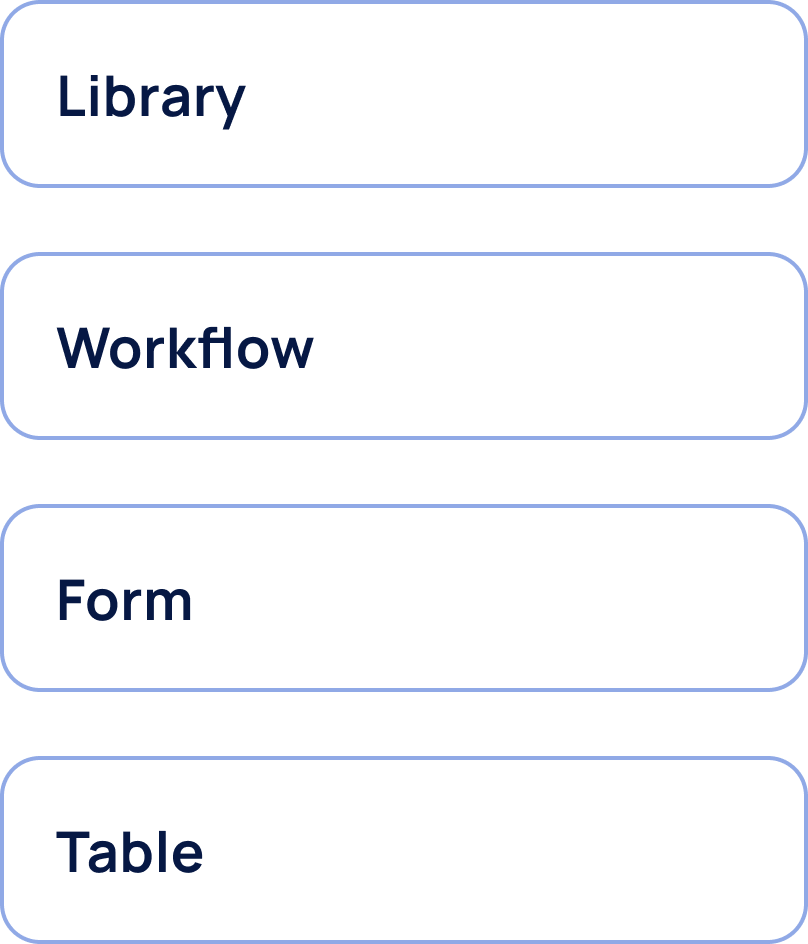
Widgets on the dashboard page can display data from various sources within Stendard Solution™, such as Library, Workflow, Data Table, and Form Builder module. When adding or editing a widget, you can configure them by selecting the data source you want to show.
The Dashboard component provides a variety of metrics that can be customised to suit your company’s specific requirements. These metrics comprise:
- Inventories of tasks allocated to individuals
- Completed workflows
- Documents that are pending review
- Records going through the approval procedure
- Responses received from submitted forms
Gone are the days of navigating multiple screens or reports to access your needed data. With our powerful Dashboard module, you can quickly access and analyse the data that matters most to your organisation. And with real-time updates and notifications, you can rest assured that you always have the most current information at your fingertips.
Our Dashboard module streamlines the monitoring process and empowers you to make informed decisions based on the most relevant data to your needs. Experience the power of data visualisation and take your insights to the next level with Stendard Solution™ Dashboard.